To gain insight into the U.S. economy, we’ve visualized the median income by state, as of May 2024. These figures come from WalletHub, which sourced income data from the U.S. Census Bureau and adjusted it for cost of living according to the Cost of Living Index (COLI).
The Cost of Living Index, published by the Council for Community and Economic Research (C2ER), was established in 1968, and allows for consistent place-to-place cost comparisons.
The index considers six categories of spending: groceries, housing, utilities, transportation, health care, and miscellaneous.
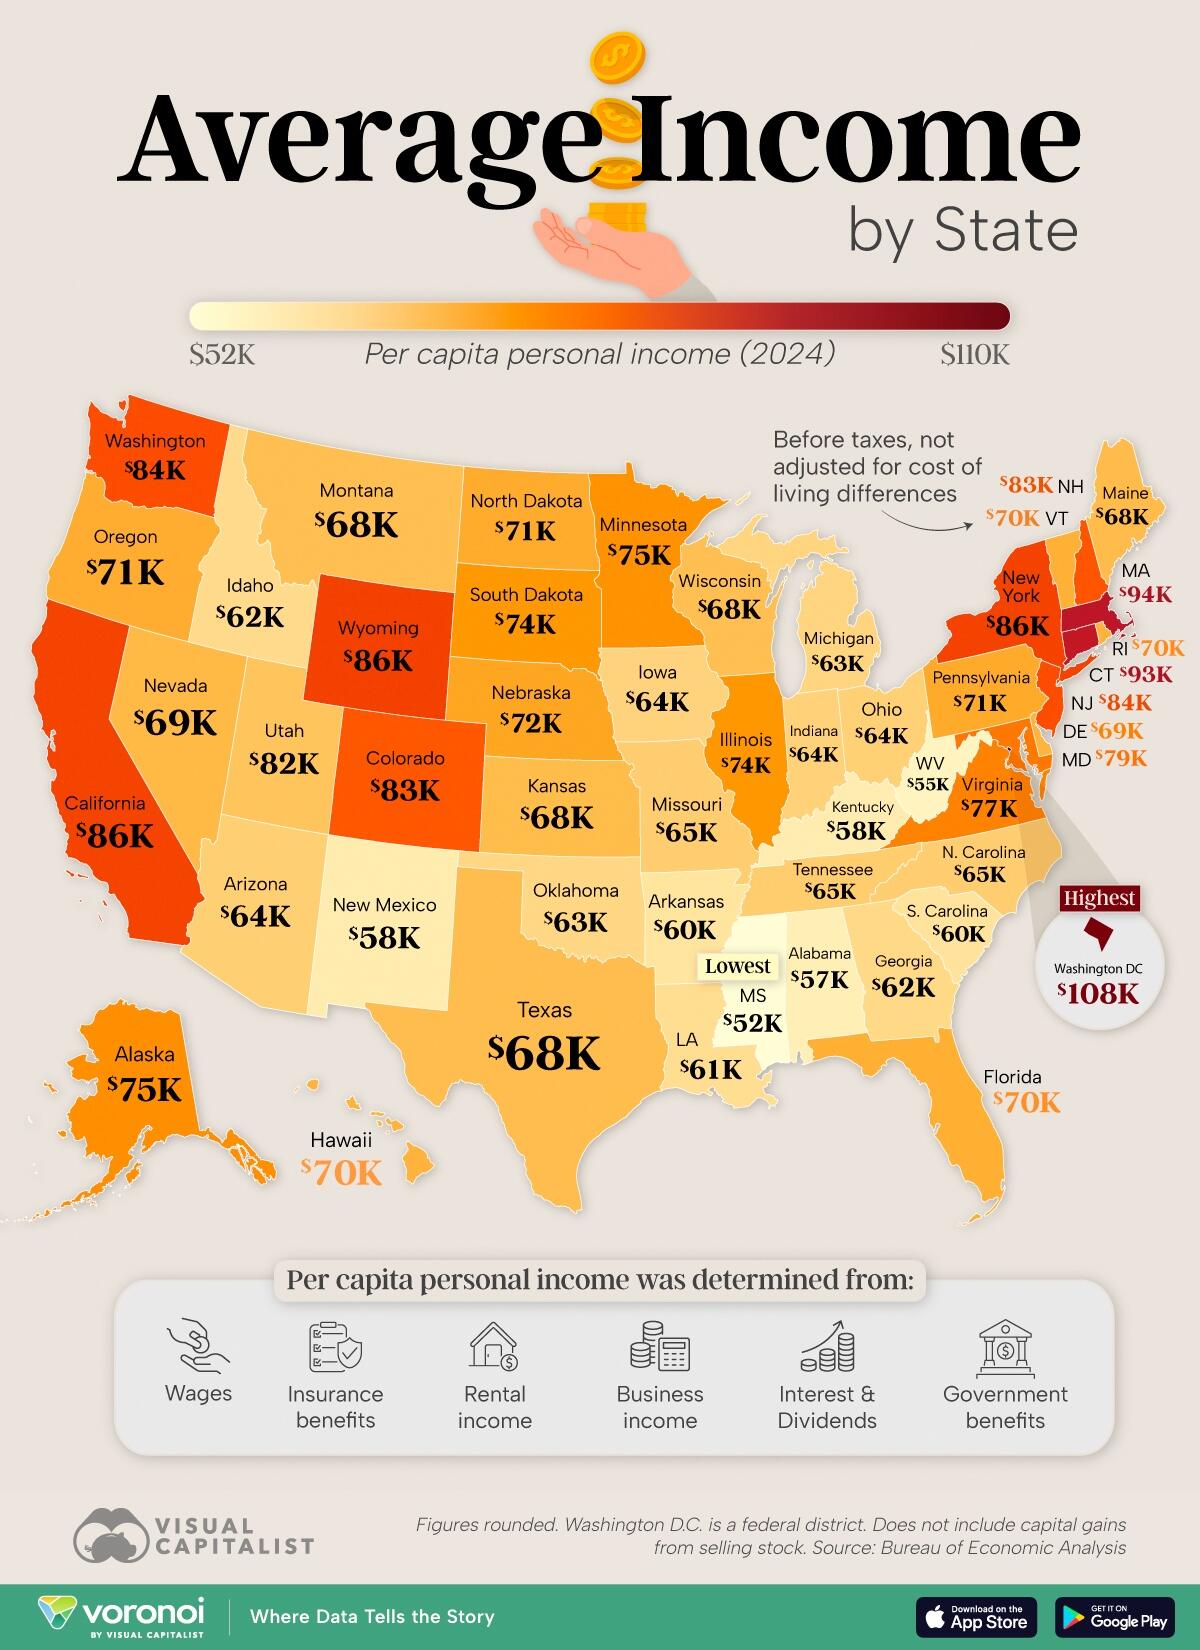
After adjusting for COLI, the top three states by median income are the District of Columbia (DC) (technically a district), Hawaii, and Massachusetts.
In DC, federal government agencies are the biggest employers. Many of them offer high-paying jobs that require higher education and specialized skills. DC, like Hawaii, also has a relatively higher cost of living, which may push up the average salary.
In the case of Massachusetts, the state is home to many of the world’s most prestigious universities and research institutions, as well as high-earning sectors like healthcare and tech.
It goes from $162,265 to $6,2446. Here is the list of states and income


