Friday Humor – The County Fair
After reading an article by one of the top economists we should listen to, it occurred to me that life isn’t fair, but that alone is fair.
An excerpt from the article starts us off:
Some years ago, for example, there was a big outcry that various mental tests used for college admissions or for employment were biased and “unfair” to many individuals or groups. Fortunately there was one voice of sanity– David Riesman, I believe– who said: “The tests are not unfair. LIFE is unfair and the tests measure the results.”
If by “fair” you mean everyone having the same odds for achieving success, then life has never been anywhere close to being fair, anywhere or at any time. If you stop and think about it (however old-fashioned that may seem), it is hard even to conceive of how life could possibly be fair in that sense.
Even within the same family, among children born to the same parents and raised under the same roof, the first-borns on average have higher IQs than their brothers and sisters, and usually achieve more in life.
Unfairness is often blamed on somebody, even if only on “society.” But whose fault is it if you were not the first born? Since some groups have more children than others, a higher percentage of the next generation will be first-borns in groups that have smaller families, so such groups have an advantage over other groups.
TRYING TO EQUALIZE THE RESULTS HAS LESS CHANCE OF SUCCESS THAN CREATING AN ENVIRONMENT TO SUCCEED
I propose that Life isn’t fair, now get over it and try harder. The American dream is to work hard, be successful and get ahead. We shouldn’t kill that dream which is what is being proposed for those making over $250,000. Further, it was said that “cursed is the ground because of you; through painful toil you will eat of it all the days of your life. it will produce thorns and thistles for you, and you will eat the plants of the field. By the swat of your brow you will eat your food until you return to the ground, since from it you were taken; for dust you are and to dust you will return.”
Some are richer, some are born into more prosperity than others, some are smarter, some have more ambition….the list goes on forever.
Here are two good examples of those that exemplify that some have it easier than others, just for being born into the right family.


To try and make it otherwise is usually a result of envy or jealousy of others success. There is no way to legislate tenacity to succeed, one’s ability vs. others, familial or environmental factors and many other causes. Some have more and do better than others, GET OVER IT.
We live in a country where people have come to because of the American Dream defined as:
The American Dream is a national ethos of the United States in which freedom includes the opportunity for prosperity and success, an upward social mobility achieved through hard work. In the definition of the American Dream by James Truslow Adams in 1931, “life should be better and richer and fuller for everyone, with opportunity for each according to ability or achievement” regardless of social class or circumstances of birth.[1] The idea of the American Dream is rooted in the United States Declaration of Independence which proclaims that “all men are created equal” and that they are “endowed by their Creator with certain inalienable Rights” including “Life, Liberty and the pursuit of Happiness.”[2]
Any effort to equalize things by wealth redistribution is socialistic and doomed to failure. I beg for someone to show me an example of where communism or socialism has succeeded. Ask Greece, the USSR, most European countries….
Why?
TO TRY AND MAKE IT EQUAL ALWAYS FAILS
There has been some talk during regarding those who make over a certain amount should give more, also called redistribution. This is directly from the mouth of a famous person in history:
From each according to his ability, to each according to his need (or needs) is a slogan popularized by Karl Marx in his 1875 Critique of the Gotha Program.
Socialism in general has a record of failure so blatant that only an intellectual could ignore or evade it.
Thomas Sowell
A free market will create big differences in wealth. That wealth disparity is simply a byproduct of freedom — vastly diverse individuals competing to serve consumers will arrive at vastly diverse outcomes.
That disparity is not unfair — if it results from free exchange.
The free market (which, sadly, America doesn’t have) is fair. It also produces better outcomes. Even “losers” do pretty well.
A more astute observer than Moore might show how unfair government intervention is. Licenses, taxes, regulations and corporate subsidies make it harder for the average worker to start his own business, to go from being a “little guy” to being an independent owner of means of production. Most new businesses fail, but running your own business is the best route to prosperity and — surveys suggest — happiness, too.
Newman, the receptionist at the company’s corporate offices, has worked for Whole Foods for six years and now makes about $17 an hour. She lives comfortably in a rented duplex, but she admitted money can get tight on occasion – like the time her dog needed a surprise $750 worth of dental care.
Ehrnstein, on the other hand, is Whole Foods’ global vice president for team member services, a position that pays him a six-figure annual salary. He and his wife, Renee, have worked more than 30 years combined at Whole Foods. They own a 3,151-square-foot home, according to Travis County Central Appraisal District records.
“I feel very grateful to be in the role I’m in, but most of all I feel grateful to work for a company that aligns with my values,” Ehrnstein said. “I feel connections with our team members in that sense. But certainly, the compensation affords different opportunities.”
This is not the stereotypical story of the gap between rich and poor. Few would criticize the wage disparity between Newman and Ehrnstein given their tenures and responsibilities at the company. Plus, the gap from top to bottom is much narrower at Whole Foods than other large grocers because it pays higher entry-level wages and caps executive pay at 19 times the salary of its lowest-paid employee.
To which I say so what. The higher up in the company they are or the more responsibility one has, the more they should earn. Their actions will bear the legal responsibility and shape the course and success of the company.
I don’t give a rats rump that someone has the chance to make more than me. We should have the opportunity to make the most money we can possibly make without the government restricting that chance. That is why we compete, innovate, work and strive for success. I say screw the idea of socialism because that is what makes America great. We compete to be the best and try to out do the other guy. It’s how we (the US) beat the Soviet’s to the Moon, *(humans) invented cars, trains, planes, computers, telephones, cellphones and is also the reason there is Apple, Facebook, Ford, steel, iPads and every other success that has been invented. We have the cure for polio, vaccines and advancements in medicine that socialized societies would never have had the incentive to create.
The planet Neptune has never been seen by anyone looking at the night sky through just their own eyes. So distant is it from the sun that the light it reflects toward the Earth is so faint that the planet is effectively invisible in the darkness of night. And yet, the outermost large planet of our solar system was discovered by astronomers who knew exactly where to look….
Following William Herschel‘s discovery of Uranus in 1781, the world’s astronomers went to work to observe and describe the seventh planet of the solar system, taking detailed measurements of its trajectory in space.
Forty years later, French astronomer Alexis Bouvard published detailed tables describing Uranus’ orbit about the sun. More than that however, his tables incorporated the lessons learned about planetary orbits from Johannes Kepler and Sir Isaac Newton to chart the path Uranus would follow into the future.
But then, something strange happened. Significant discrepancies between Bouvard’s projected path for Uranus and its actual orbit began to be observed – irregularities that were not observed in the tables he had created to describe the orbital paths of the planets Jupiter and Saturn using the same methods. Soon, observations and detailed measurements confirmed that Uranus was moving along a path that was not described by Bouvard’s careful calculations.
These irregularities led Bouvard to hypothesize that an as yet unseen eighth planet in the solar system might be responsible for what he and other astronomers were observing.
Over twenty years later, astronomer Urbain Le Verrier was working on the problem, taking a unique approach to resolving it.
What made Le Verrier’s work unique is that he applied the math developed by Sir Isaac Newton to describe the gravitational attraction between two bodies to solve the problem. Here, he used Newton’s theory to anticipate where an as yet unknown, but more distant planet also orbiting the sun would have to be to create the effects observed upon the position of the planet Uranus in its orbit.
Le Verrier completed his calculations regarding the position of the hypothetical eighth planet on 1 June 1846. A little over three months later, on 23 September 1846, the planet Neptune was observed for the first time at almost exactly the position in space where Le Verrier predicted it would be, confirming Newton’s gravitational theory in the process.
We’re going to do something similar today to explain why household income inequality in the United States has increased over time, even though there has been no change in individual income inequality.
Our first chart below is based on data taken from the U.S. Census’ data [Excel spreadsheet] on the inflation-adjusted median and mean income for all Americans from 1947 through 2010, which we’ve presented in terms of constant 2010 U.S. dollars. For reference, we’ve also indicated the NBER’s official periods of recession in the U.S. during this period with the shaded red vertical bands on the chart:

Next, we took the U.S. Census’ breakdown of inflation-adjusted median income for both men and women for each of these years [Excel spreadsheet] and used the math that applies to log-normal distributions to construct the combined median income that applies to individuals. Our results are shown in the chart below, along with the actual median incomes reported by the U.S. Census so we can compare our calculated results with them:
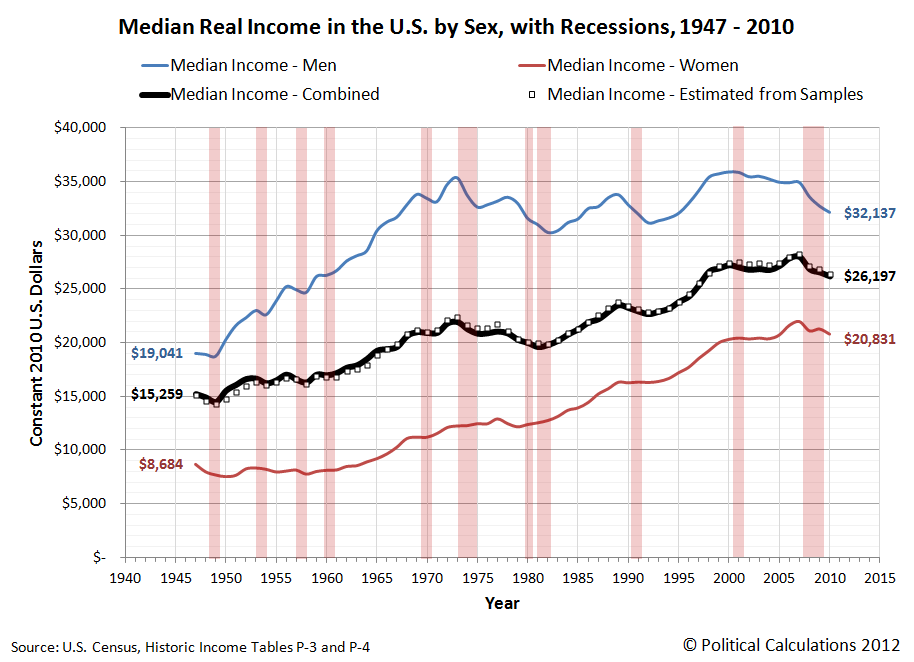
As you can see, our calculated results in creating a weighted median from the subsets of median income data for men and women are very close to the actual real median income numbers for all individuals. Here, because per capita income has been demonstrated to follow a log-normal distribution, we are able to use this math to either combine or extract subsets of data that have never been officially presented.
As an aside, we achieved the results above by treating the reported median income data the way we might calculate a weighted average. The beauty of the log-normal distribution math is that we can do this with medians, which we ordinarily could not do otherwise.
In the chart above, you can see the effect of the changing composition of the U.S. workforce, as the relative share of women earning incomes in the United States has increased since 1947. In 1947, the median income for individuals is much closer to the median income for men than it is for women. By 2010 however, we see that the median income for individuals is about halfway in between the median incomes for men and for women, reflecting that nearly equal share that both sexes now have among all individual income earners in the U.S.
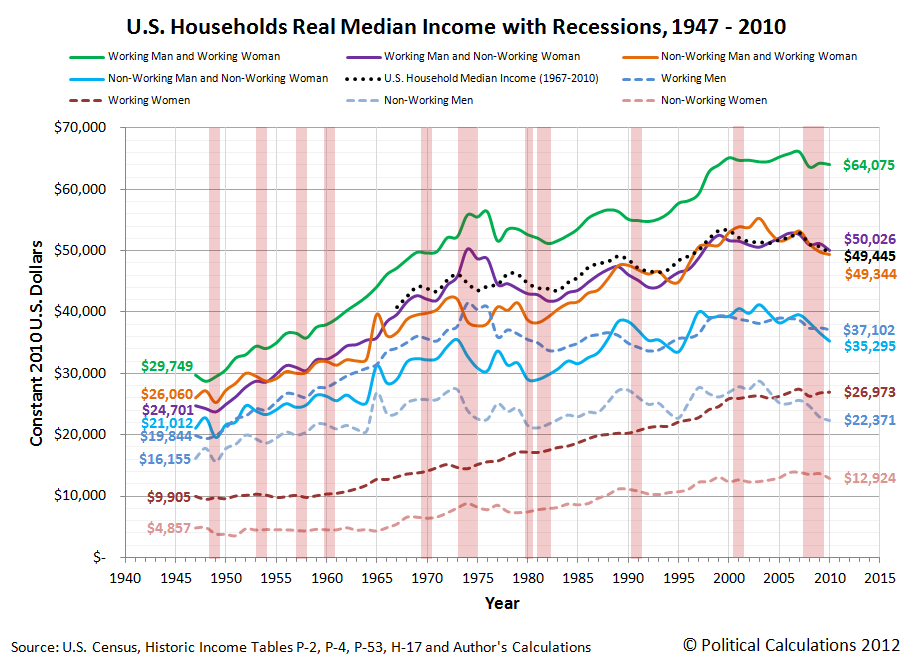
The U.S. Census Bureau provides the median income data for individuals (or persons), men and women. It also reports median income data for both male and female wage or salary earners [Excel spreadsheet], whom we’ll simply describe as Working Men and Working Women.
Using the math we demonstrated above with this data, we can extract the median incomes for two categories of people for whom the U.S. Census has never reported median incomes: men and women with incomes who do not earn wages or salaries, or as we’ll describe them from now on, Non-Working Men and Non-Working Women! Today, we’re putting what we found for all U.S. individual income earners together for the first time:

Now, let’s combine our median income earners into two-person households, pairing working men and women, working men and non-working women, non-working men and working women and finally non-working men and non-working women. We’ve shown our results below, along with the U.S. Census’ official median income for U.S. households:

Well, look at that! The households formed by our single-wage and salary income earning couples from 1947 through 2010 closely parallels the actual real median income for U.S. households with a working man and non-working woman over that time (except for the years 1974 through 1977, where there seems to be an anomaly in the Census’ data for working men – and here, the actual median splits the difference!) Also keeping in mind that the actual median household income might include the income contributions of additional people (say individuals between the ages of 16 and 24 who might be working part time at minimum wage jobs while also attending school and living at home with their parents), which likely accounts for the difference between the two, we’ve pretty much just demonstrated that we can successfully model basic U.S. households using just the data that applies for U.S. individuals.
But wait! What about single person households? Our next chart throws them into the mix as well!
Using the figures for 2010, we approximated the income percentiles for each of our single and two-person median income earning households. The table below reveals our results (our model should put each approximated percentile within 0.2 of the actual percentile!):
| Household Type | 2010 Median Income | Approximate Income Percentile |
|---|---|---|
| Working Men and Working Women | $64,075 | 61.4 |
| Working Men and Non-Working Women | $50,026 | 50.7 |
| Working Women and Non-Working Men | $49,344 | 50.1 |
| Non-Working Men and Women | $35,295 | 36.7 |
| Working Men Only | $37,102 | 38.6 |
| Working Women Only | $26,973 | 27.7 |
| Non-Working Men Only | $22,371 | 22.4 |
| Non-Working Women Only | $12,924 | 11.5 |
It occurs to us that all we would need to increase the income inequality among households in the United States is to increase the nation’s percentage of single person households among all households. That would work by increasing the number of households at the lower end of the income spectrum, even though it would have absolutely no effect upon the measured income inequality for individuals. The U.S. Census Bureau shows the change in the number of single person households since 1960:

Here’s the U.S. Census Bureau’s Gini index measure of the amount of income equality among U.S. households for the years from 1947 through 2010:

And here is the Gini index measure of the amount of income equality among U.S. individuals for the years from 1947 through 2005 (the data since 2005 is presented here – it’s similar to all that recorded since 1960 in the chart below):
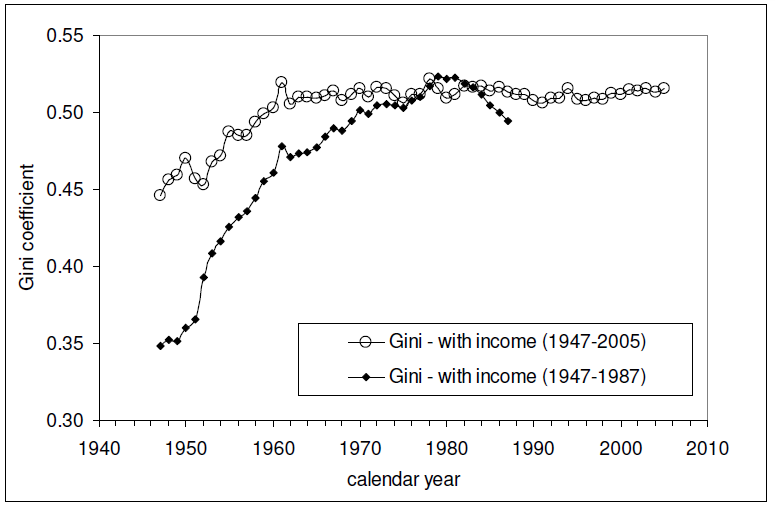
The relevant data in the chart above is the Gini measure indicated with the hollow circles, which is based on the “fine”, or more detailed, income bins reported by the U.S. Census in its annual Current Population Survey. The other data in the chart, indicated by solid diamonds, represents income distribution data reported by the U.S. Census in larger, or more “coarse” income bins, which are less detailed and are therefore a much less accurate measure of the nation’s level of income inequality in any given year.
Looking at where all the data in these three charts intersect and overlap, What we find is that since 1960, the level of income inequality for U.S. individuals as measured by the “fine” Gini index is nearly constant, but has increased significantly for U.S. households. What has changed over that time is the composition of U.S. households, with a steady increase in the percentage of single person households.
Without a corresponding increase in the measured income inequality for U.S. individuals, the increase in the measured income inequality for U.S. households has been almost entirely driven by the increase in the number of single person households over time.
So income inequality among U.S. households isn’t increasing because the rich are getting richer. That means that policies intended to right this situation by going after the rich in the name of “fairness” are guaranteed to fail, because the real cause of the increase in income inequality among U.S. households over time is something that cannot be fixed by such actions.
If only the people pushing such policies could see that….