
There’s an old joke: are you working hard, or hardly working?
“Hard work” is difficult to measure, but it is possible to know who’s working the longest.
This heatmap, via Visual Capitalist’s Pallavi Rao, visualizes the average hours Europeans work each week by country, as sourced from Eurostat’s Labor Force Survey (2023).
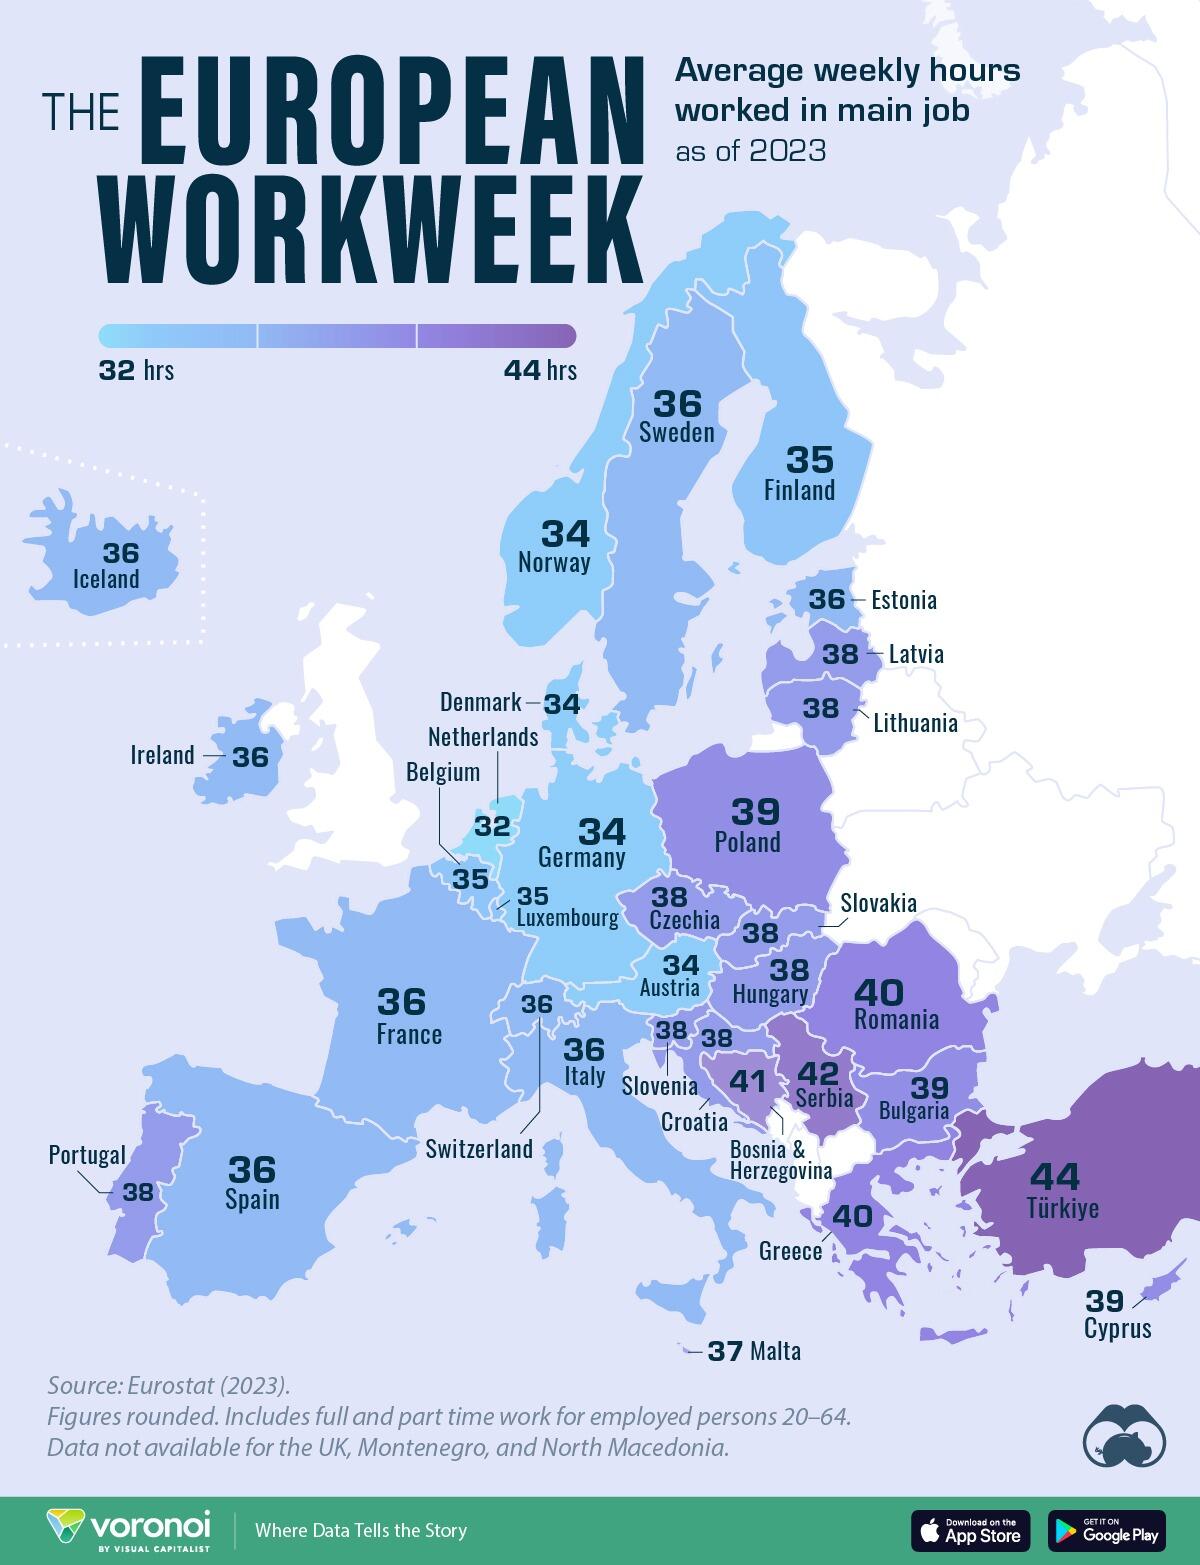
The dataset covers employed persons aged 20–64 in a “main occupation” and includes full and part time work.
The Balkans Work the Longest in Europe
Less wealthy countries of Europe (by per capita GDP) tend to have longer work weeks. For example, people in the Balkans—including Türkiye, Serbia, Bosnia & Herzegovina, Greece, and Romania—all put in an average of 40+ hours a week at their main jobs.
| Rank | Country | Average Weekly Hours Worked (2023) |
|---|---|---|
| 1 | 🇹🇷 Türkiye | 44 |
| 2 | 🇷🇸 Serbia | 42 |
| 3 | 🇧🇦 Bosnia & Herzegovina | 41 |
| 4 | 🇬🇷 Greece | 40 |
| 5 | 🇷🇴 Romania | 40 |
| 6 | 🇵🇱 Poland | 39 |
| 7 | 🇧🇬 Bulgaria | 39 |
| 8 | 🇨🇾 Cyprus | 39 |
| 9 | 🇱🇻 Latvia | 38 |
| 10 | 🇱🇹 Lithuania | 38 |
| 11 | 🇭🇷 Croatia | 38 |
| 12 | 🇸🇮 Slovenia | 38 |
| 13 | 🇨🇿 Czechia | 38 |
| 14 | 🇭🇺 Hungary | 38 |
| 15 | 🇵🇹 Portugal | 38 |
| 16 | 🇸🇰 Slovakia | 38 |
| 17 | 🇲🇹 Malta | 37 |
| 18 | 🇪🇪 Estonia | 36 |
| 19 | 🇪🇸 Spain | 36 |
| 20 | 🇮🇸 Iceland | 36 |
| 21 | 🇨🇭 Switzerland | 36 |
| 22 | 🇮🇹 Italy | 36 |
| 23 | 🇫🇷 France | 36 |
| 24 | 🇸🇪 Sweden | 36 |
| 25 | 🇮🇪 Ireland | 36 |
| 26 | 🇱🇺 Luxembourg | 35 |
| 27 | 🇧🇪 Belgium | 35 |
| 28 | 🇫🇮 Finland | 35 |
| 29 | 🇩🇰 Denmark | 34 |
| 30 | 🇩🇪 Germany | 34 |
| 31 | 🇳🇴 Norway | 34 |
| 32 | 🇦🇹 Austria | 34 |
| 33 | 🇳🇱 Netherlands | 32 |
| N/A | 🇪🇺 EU (2020) | 36 |
My wife’s European family loves to tell me how little they work. They are also paying 70% taxes. I wish I cared, but I don’t really even wish that.

